


A recent study by Marques and colleagues has generated significant discussion within the exercise science community by challenging long-held assumptions about the relationship between muscle hypertrophy and strength gains. Titled "Muscle Growth Is Very Strongly Correlated with Strength Gains after Lower Body Resistance Training: New Insight from Within-Participant Associations," the paper argues that previous research may have drastically underestimated how closely muscle growth tracks with improvements in strength simply due to suboptimal statistical methods. However, a deeper look into the mechanics of the statistical approach used—repeated measures correlation—reveals that these striking results might not mean what they appear to at first glance.

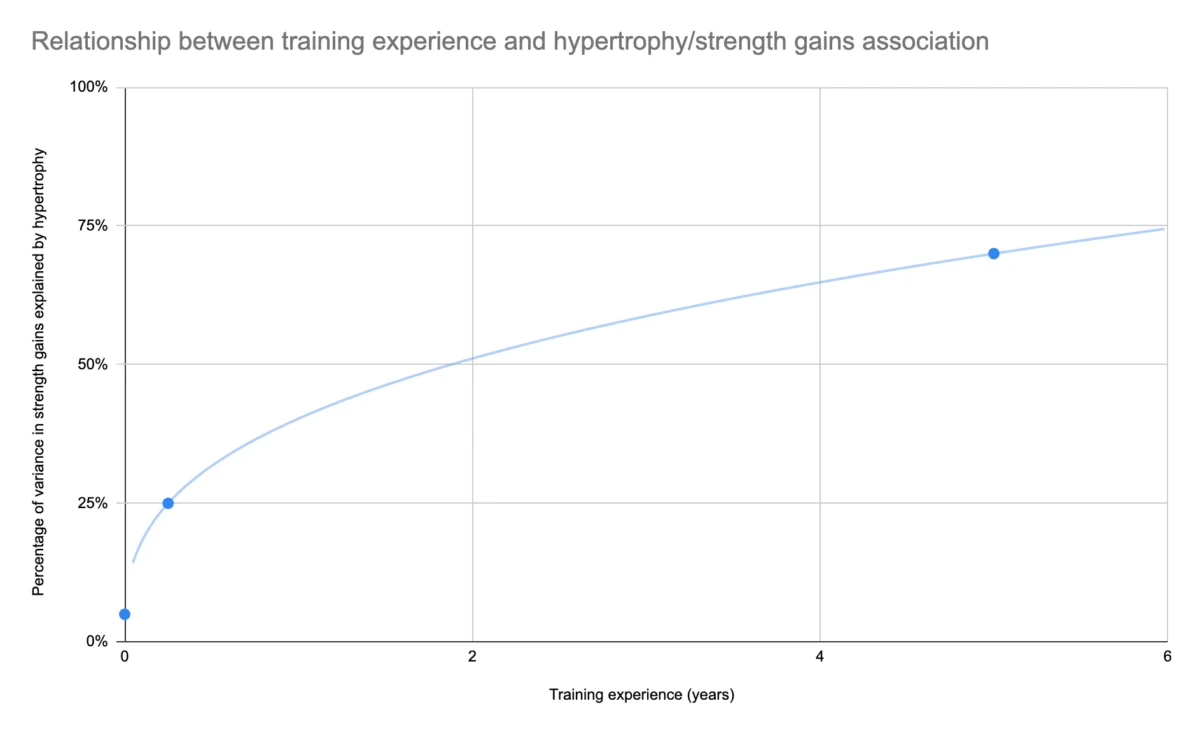
For years, research investigating the relationship between hypertrophy and strength gains has painted a fairly consistent picture. In studies involving untrained subjects, the relationship between muscle growth and strength gains is typically weak. As training status increases, however, this relationship grows progressively stronger. In completely untrained subjects, hypertrophy appears to explain very little of the variance in strength gains. In subjects with a few months of prior training experience, researchers generally observe higher R-squared values in the 0.2 to 0.3 range, while well-trained subjects can see R-squared values near 0.7, meaning hypertrophy explains roughly 70 percent of the variance in strength gains.

This progression makes intuitive sense from a physiological standpoint. If hypertrophy is causally related to strength gains, we should expect the relationship to tighten as other confounding factors become more normalized between subjects. Early strength gains are primarily driven by improvements in technique and motor learning. In studies on untrained lifters, researchers commonly observe average gains of roughly a 5 percent increase in muscle size alongside a 22 percent increase in strength. Even if hypertrophy has a causal impact in this population, it can only explain a fraction of the observed strength gains. As lifting experience increases, however, there are fewer marginal gains to be had from technique adjustments, meaning hypertrophy accounts for a larger share of the variance in strength gains.

Despite this well-accepted framework, the study by Marques and colleagues appeared to flip conventional understanding on its head. The researchers proposed that previous literature relied too heavily on between-participant analyses, such as simple linear regression or Pearson’s correlation. These methods assess interindividual associations but can lack sensitivity when capturing within-participant changes over time. By utilizing repeated measures correlation, which accounts for the non-independence of paired data gathered from the same individuals, the researchers sought to analyze intraindividual associations more accurately.

To illustrate the underlying concept, imagine two people with biceps of identical size. Person A has favorable internal moment arms and very high specific tension, while Person B has unfavorable insertions and low specific tension. If both experience the exact same 5 percent increase in muscle size, Person A will likely achieve a significantly larger gain in strength than Person B. When plotted across a cohort of twenty to thirty subjects, this variation can make the relationship between hypertrophy and strength gains appear weak on a group level, even if the direct effect of muscle growth remains robust within each individual.

While repeated measures correlation is a valid tool designed to account for these inter-individual differences, its application in the Marques study produced extraordinary results. Evaluating thirty-nine untrained men who completed a 15-week lower body resistance training program, the researchers reported repeated measures correlation coefficients of 0.92 for isometric knee extension strength and 0.89 for knee extension 1RM. In contrast, traditional between-subjects associations fell within the 0.35 to 0.60 range. Taken at face value, these findings suggested that prior research had missed an almost perfect relationship between muscle growth and strength gains due to statistical blind spots.

However, a closer examination suggests a more nuanced reality. The first sign that something required deeper investigation emerged when comparing these findings to a prior study by Vigotsky and colleagues. If traditional research methods were simply failing to capture the true relationship because they lacked within-subject analyses, the Vigotsky study should have yielded similarly sky-high correlations. In fact, Vigotsky utilized a hierarchical linear model that allowed both intercepts and slopes to vary between subjects—a method theoretically capable of explaining even more variance than the repeated measures correlation used by Marques, which assumes a uniform slope across subjects. Yet, the Vigotsky study found that hypertrophy explained less than 25 percent of the variance in strength gains.

To understand why the Marques study produced such high correlation coefficients, it is helpful to examine what kind of association would appear if hypertrophy and strength gains were entirely unrelated. By generating five hundred sports-science simulations matching the summary statistics of the Marques paper where muscle growth had zero causal impact on strength, researchers discovered a surprising baseline effect. Even in a theoretical universe where hypertrophy has no effect on strength, the repeated measures correlation method applied to these specific summary statistics still returns R-values in the 0.81 to 0.83 range.

In other words, repeated measures correlation can make it appear as though hypertrophy explains roughly 65 to 70 percent of the variance in strength gains, even if the two variables are completely independent. When factoring in this null case, the reported R-values of 0.89 to 0.92 lose much of their initial shock value. While they remain higher than what would be expected by pure chance, they indicate that hypertrophy accounts for only an additional 12 to 17 percent of variance beyond what random noise matching the subject statistics would generate. Furthermore, the correlation coefficient for 1RM strength in the Marques study does not even differ statistically from the null baseline when evaluated within its confidence intervals.

None of this suggests dishonesty or flaws in the primary execution of the Marques study. The researchers utilized a longer training duration than typical untrained-subject trials, ran for 15 weeks, and employed an isometric measurement that minimized skill acquisition confounds. As a result, their traditional between-subjects Pearson regression analysis already yielded stronger correlations than normally observed in the literature.

The core takeaway centers on how exercise science data is analyzed and interpreted moving forward. As repeated measures correlations begin appearing more frequently in sports science literature, researchers and consumers alike must exercise caution. Without running appropriate simulations to establish a null baseline, high correlation coefficients can easily be misinterpreted as definitive proof of massive causal relationships when they are heavily influenced by the underlying mathematics of change score coefficients of variation. Properly contextualizing these statistical models ensures that future insights into muscle growth and strength remain grounded in physiological reality rather than mathematical artifacts.