


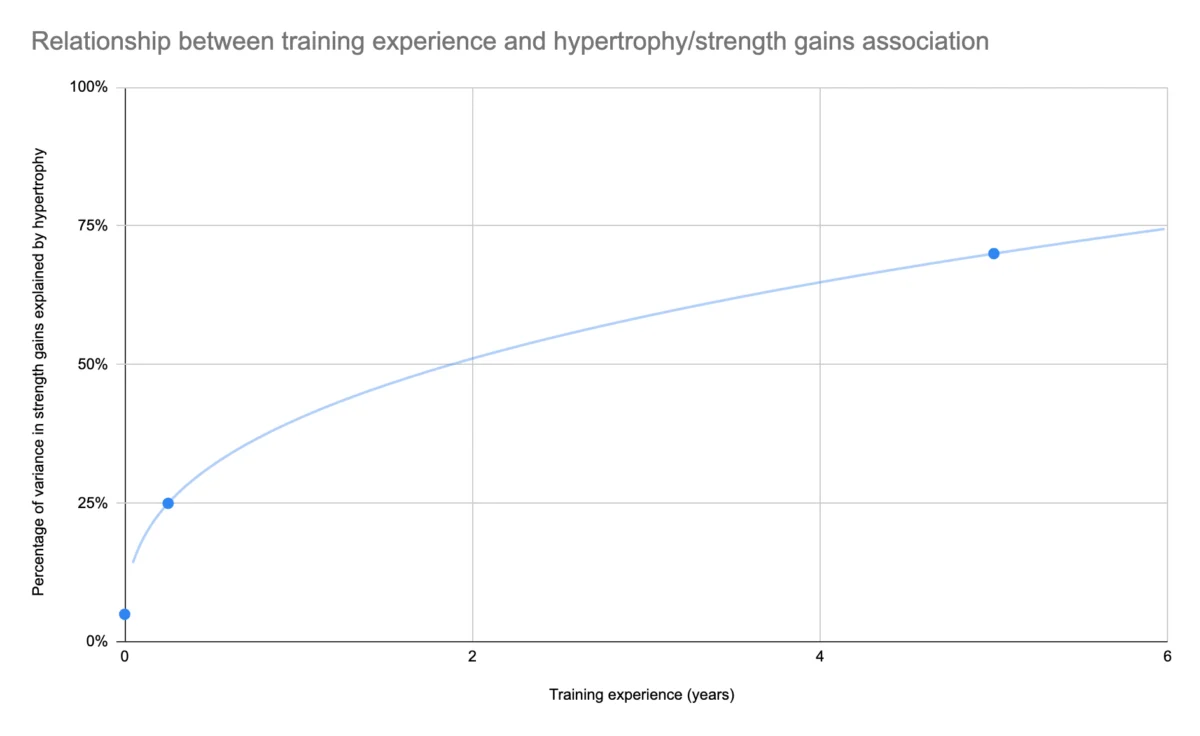
For years, exercise scientists and strength coaches have debated the exact mathematical relationship between muscle hypertrophy and strength gains. Traditionally, the scientific literature has painted a fairly consistent picture: in untrained individuals, the correlation between getting bigger and getting stronger is surprisingly weak. Early strength gains are driven primarily by neuromuscular adaptations, motor learning, and improved technique rather than sheer muscle mass. However, as lifters gain experience and their technique plateaus, the relationship between muscle size and strength becomes progressively stronger, with well-trained subjects often showing coefficients where hypertrophy explains a major portion of the variance in strength gains.

This long-standing framework was seemingly upended by a recent paper from Marques and colleagues, titled "Muscle Growth Is Very Strongly Correlated with Strength Gains after Lower Body Resistance Training: New Insight from Within-Participant Associations." Published in Medicine & Science in Sports & Exercise, the study proposed that prior research may have drastically underestimated the true relationship between hypertrophy and strength gains by relying on suboptimal statistical methods. Specifically, the authors argued that traditional between-participant analyses—such as simple linear regressions or Pearson correlations using pre- and post-training percentage changes—fail to capture true within-participant changes over time.

To overcome this, Marques and colleagues utilized a repeated-measures correlation approach. In their 15-week study tracking 39 untrained men undergoing quadriceps resistance training, the results were staggering. While traditional between-subject correlations yielded modest R-values, the repeated-measures correlation produced r-values of 0.92 for isometric knee extension strength and 0.89 for knee extension 1RM. Taken at face value, these statistics implied that hypertrophy accounted for roughly 80 to 85 percent of the variance in strength gains, suggesting an almost perfect causal relationship that previous generations of researchers had somehow missed entirely due to flawed statistics.

However, a closer look at the mechanics of repeated-measures correlation reveals that these headline-grabbing numbers require a significant dose of caution. The first clue that something required deeper investigation came when comparing these findings to earlier work by Vigotsky and colleagues. That prior study utilized hierarchical linear models (HLMs) designed to assess within-subject associations by allowing both the intercepts and slopes of the size-strength relationship to vary across individuals. If the true relationship between hypertrophy and strength gains in untrained subjects was genuinely above 80 percent, the more flexible models used in the Vigotsky study should have uncovered it. Instead, those within-subject analyses found that hypertrophy explained less than 25 percent of the variance.

To understand why Marques and colleagues arrived at such vastly different conclusions, it is necessary to examine what happens when you run a repeated-measures correlation on data where two variables are entirely unrelated. By generating thousands of simulated subjects matching the summary statistics of the Marques paper—but with muscle growth and strength gains designed to be completely independent of one another—a fascinating mathematical reality emerges. Even in a purely hypothetical universe where hypertrophy has zero causal impact on strength gains, performing a repeated-measures correlation on the data still yields inflated r-values, often clustering in the 0.81 to 0.83 range.

In other words, standard repeated-measures correlation techniques can make it appear as though muscle growth explains 65 to 70 percent of the variance in strength gains, even if the two phenomena have no relationship whatsoever. When viewed through this lens, the reported r-values of 0.89 to 0.92 in the Marques study lose much of their shocking nature. While they remain nominally higher than what would be expected in a complete null case, they ultimately indicate that hypertrophy only accounts for an additional 12 to 17 percent of variance above and beyond what random noise would produce given the participants’ baseline summary statistics.

Furthermore, the confidence intervals reported in the study further emphasize the need for careful interpretation. The correlation coefficient for 1RM strength in the Marques paper did not even differ statistically from the baseline expectations of the null simulation, meaning researchers cannot confidently claim that an r-value of 0.89 proves a stronger association than what could arise purely by chance under specific mathematical conditions.

None of this is to suggest that Marques and their team committed methodological malpractice or behaved dishonestly. The study itself exhibited strong overall methodological quality, featuring a longer training duration than typical untrained studies (15 weeks), robust MRI assessments of quadriceps volume, and the inclusion of maximal isometric knee extension torque to minimize the confounding variables of motor skill acquisition. Their baseline Pearson correlations were also noticeably stronger than the historical average for untrained cohorts, reflecting the benefits of longer training windows and reduced measurement noise.

Instead, the core issue lies in how modern statistical tools like repeated-measures correlations are interpreted within the exercise science community. As these advanced analytical methods become more common in published literature, researchers and consumers of scientific data alike must look beyond surface-level correlation coefficients. Without running simulations to establish a baseline "null case" for a specific dataset, high r-values can easily be misinterpreted as definitive proof of massive causal relationships when they are heavily influenced by the underlying coefficients of variation in change scores.

Moving forward, the scientific community would benefit from conducting simulations prior to publication to determine what a null result actually looks like under repeated-measures analysis. Additionally, incorporating multiple measurement time points—such as pre-, mid-, and post-training assessments—can help untangle true physiological relationships from statistical artifacts. Ultimately, while hypertrophy and strength gains are undeniably linked, understanding the true nature of that relationship requires looking past dazzling statistical outputs and examining the foundational math holding the data together.